MARKET DATA DEFINITIONS
MARKET DATA FILES
The market data files are presented in two formats, firstly in the general Access database, and secondly, in the various spreadsheets. In the market data tables and spreadsheets are found as M?? (the forecast market), Q?? (the forecast market data for unique products), A?? (the forecast market data for top 15 product segments by market value), B?? (the forecast market data for top 15 product segments by market share) , D?? (the forecast market data for top 15 product segments by market growth), ; where, ?? are the various forecasted financial scenarios:
Data files ‘A_TOT’, ‘B_TOT’ and ‘D_TOT’ are the Totals for all the Scenarios for tables A??, B?? and D?? | |||||||||||||||||||||||||||||||||||||||||||||||||||||||||||||||||||||||||||||||||||||||||||||||||||||||||||||||||||||||||||||||||||||||||||||||||||||||||||||||||||||||||||||||||||||||||||||||||||||||||||||||||||||||||||||||||||||||||||||||||||||||||||||||||||||||||||||||||||||||||||||||||||||||||||||||||||||||||||||||||||||||||||||||||||||||||||||||||||||||||||||||||||||||||||||||||||||||||||||||||||||||||||||||||||||||||||||||||||||||||||||||||||||||||||||||||||||||||||||||||||||||||||||||||||||||||||||||||||||||||||||||||||||||||||||||||||||||||||||||||||||||||||||||||||||||||||||||||||||||||||||||||||||||||||||||||||||||||||||||||||||||||||||||||||||||||||||||||||||||||||||||||||||||||||||||||||||||||||||||||||||||||||||||||||||||||||||||||||||||||||||||||||||||||||||||||||||||||||||||||||||||||||||||||||||||||||||||||||||||||||||||||||||||||||||||||||||||||||||||||||||||||||||||||||||||||||||||||||||||||||||||||||||||||||||||||||||||||||||||||||||||||||||||||||||||||||||||||||||||
The data file ‘MM’ is the historic market data (from 1972) for each product covered. | |||||||||||||||||||||||||||||||||||||||||||||||||||||||||||||||||||||||||||||||||||||||||||||||||||||||||||||||||||||||||||||||||||||||||||||||||||||||||||||||||||||||||||||||||||||||||||||||||||||||||||||||||||||||||||||||||||||||||||||||||||||||||||||||||||||||||||||||||||||||||||||||||||||||||||||||||||||||||||||||||||||||||||||||||||||||||||||||||||||||||||||||||||||||||||||||||||||||||||||||||||||||||||||||||||||||||||||||||||||||||||||||||||||||||||||||||||||||||||||||||||||||||||||||||||||||||||||||||||||||||||||||||||||||||||||||||||||||||||||||||||||||||||||||||||||||||||||||||||||||||||||||||||||||||||||||||||||||||||||||||||||||||||||||||||||||||||||||||||||||||||||||||||||||||||||||||||||||||||||||||||||||||||||||||||||||||||||||||||||||||||||||||||||||||||||||||||||||||||||||||||||||||||||||||||||||||||||||||||||||||||||||||||||||||||||||||||||||||||||||||||||||||||||||||||||||||||||||||||||||||||||||||||||||||||||||||||||||||||||||||||||||||||||||||||||||||||||||||||||||
Where more than one set of NAICS or SIC product code groups are included then these above data files are also provided as separate files, E.g. M01_211211, M01_321211, et cetera, where the digits after the "_"is the NAICS or SIC product code. | |||||||||||||||||||||||||||||||||||||||||||||||||||||||||||||||||||||||||||||||||||||||||||||||||||||||||||||||||||||||||||||||||||||||||||||||||||||||||||||||||||||||||||||||||||||||||||||||||||||||||||||||||||||||||||||||||||||||||||||||||||||||||||||||||||||||||||||||||||||||||||||||||||||||||||||||||||||||||||||||||||||||||||||||||||||||||||||||||||||||||||||||||||||||||||||||||||||||||||||||||||||||||||||||||||||||||||||||||||||||||||||||||||||||||||||||||||||||||||||||||||||||||||||||||||||||||||||||||||||||||||||||||||||||||||||||||||||||||||||||||||||||||||||||||||||||||||||||||||||||||||||||||||||||||||||||||||||||||||||||||||||||||||||||||||||||||||||||||||||||||||||||||||||||||||||||||||||||||||||||||||||||||||||||||||||||||||||||||||||||||||||||||||||||||||||||||||||||||||||||||||||||||||||||||||||||||||||||||||||||||||||||||||||||||||||||||||||||||||||||||||||||||||||||||||||||||||||||||||||||||||||||||||||||||||||||||||||||||||||||||||||||||||||||||||||||||||||||||||||||
| |||||||||||||||||||||||||||||||||||||||||||||||||||||||||||||||||||||||||||||||||||||||||||||||||||||||||||||||||||||||||||||||||||||||||||||||||||||||||||||||||||||||||||||||||||||||||||||||||||||||||||||||||||||||||||||||||||||||||||||||||||||||||||||||||||||||||||||||||||||||||||||||||||||||||||||||||||||||||||||||||||||||||||||||||||||||||||||||||||||||||||||||||||||||||||||||||||||||||||||||||||||||||||||||||||||||||||||||||||||||||||||||||||||||||||||||||||||||||||||||||||||||||||||||||||||||||||||||||||||||||||||||||||||||||||||||||||||||||||||||||||||||||||||||||||||||||||||||||||||||||||||||||||||||||||||||||||||||||||||||||||||||||||||||||||||||||||||||||||||||||||||||||||||||||||||||||||||||||||||||||||||||||||||||||||||||||||||||||||||||||||||||||||||||||||||||||||||||||||||||||||||||||||||||||||||||||||||||||||||||||||||||||||||||||||||||||||||||||||||||||||||||||||||||||||||||||||||||||||||||||||||||||||||||||||||||||||||||||||||||||||||||||||||||||||||||||||||||||||||||
MARKET DATA DEFINITIONS
NOTES AND DEFINITIONS
ALL FIGURES IN THIS SECTION ARE IN REAL TERMS
REAL TERMS are figures excluding the effects of inflation, thus the Forecasts and figures given can be readily converted into units or volume. This is done by applying the average prices for the base year and dividing the figures by this price for all years. Thus it is possible to easily ascertain both historic and forecasted product volume.
A "most recent published accounts" base is used because most company accounts are historic and thus clients will be able to compare the figures given in this report with their own company figures without the need for conversion or the need for inflators or multiplying factors.
AVERAGE SALES PRICES ARE NOT APPROPRIATE OR APPLICABLE TO THIS DATABASE
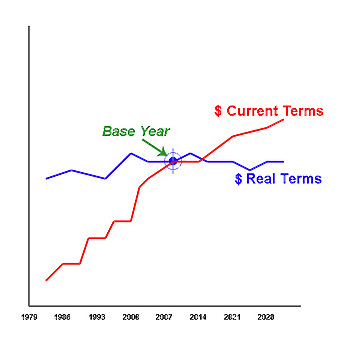
The effect of using Real Terms figures is that the forecasted figures will be depressed, as they do not include inflation, and figures from former years (i.e. before the Base Year) will be increased:-
In the diagram below, a Base Year is at the convergent point, and the Current Terms is "—". This Current Cost usually increases because of the effects of inflation. The Real Terms figures, "—", does not include the effects of inflation and thus only increases or decreases if the actual product volume or units increase or decrease. In this way it is possible to evaluate the market and other figures more realistically.
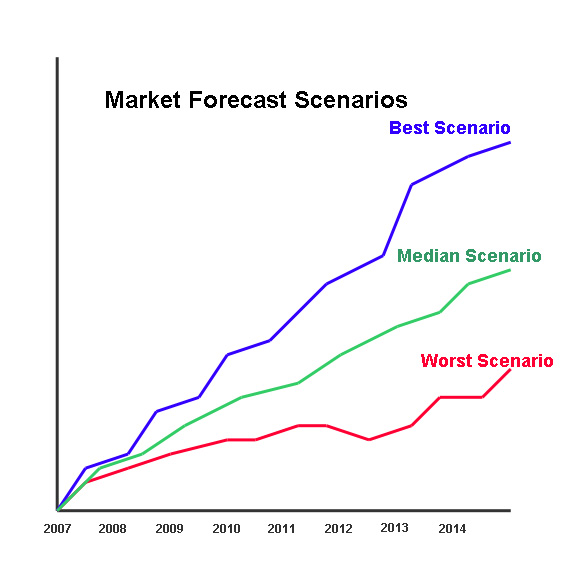
The figures and the Trend figures represent an overall median probability trend line that is plotted to give the most probable course amongst the annual forecast scatter. Thus, the figures do not reflect year-on-year depressions and peaks in absolute terms, but instead represents a year-on-year modified trend line. The various SCENARIOS provided in the database reflect the differential forecasts specific to the factors being forecast.
THIS SECTION USES REAL TERMS FORECASTS
The diagram describes the method used to provide a median probability forecast. In any forecasting model there are a number of possible forecast scenarios, these are represented above as "—", "—" and "—", the median probability ( "—" ) plots a curve through the possible forecasts which represent the most probable scenario. This method of forecasting is used in all the forecasts and trends given in this report.
The U.S. government uses the term Constant dollars (or "real" dollars) and this is defined thus: Output values converted to a base price level, calculated by dividing current (or actual) dollars by a deflator. Use of constant dollars eliminates the effects of price changes between the year of measurement and the base year and allows calculation of real changes in output.
CURRENCY DATA: The currency figures given in this report are in U.S. Dollars. If the Windows Regional Settings on your computer is set to a non-U.S. setting then the currency symbol ($) may appear in the local currency (€, £, ¥, etc.). Either reset your Regional settings, or alternatively read all currency figures in this report as being U.S. Dollars (US$).
HISTORIC AND FORECAST MARKET DATA TRANSITION PERIODSThe HISTORIC DATA covers the years from 1997 to Current, and the initial FORECAST DATA series covers the years Current to 2028. There is always a transition period; which is in fact during the last two quarters, i.e. whilst the historic data is being collated. In addition the data given for the next two quarters is considered an estimate rather than a forecast. Thus the 12 month period around the database output date is an estimate. In terms of the various Market Scenarios it must be assumed that the Scenario factor or strategy being considered will not exert an impact on the forecast immediately and will not become evident for some time after its inception. Whilst the forecasting models used operates on a monthly time scale and does also take account of other temporal factors (for example seasonality of demand, industry accounting periods, et al) it would be too pedantic to express the transition year in greater detail. Therefore in the forecast data a straight line plot is produced between the BASE year (Current), through the transition period (Year +1) to the first forecast year (Year +2). [Users of the more detailed editions of this database will have forecasts on a monthly time series and thus these users will have a monthly, seasonally adjusted plot and not a straight line plot during the transition period.] |
THE MARKET ENVIRONMENT
There are four basic issues to investigate when considering the market environment:
1. Market Growth
2. Market Structure
3. Market/s Serviced
4. Customer & End User Factors
1. MARKET GROWTH (both short-term and medium term) is fully analyzed in other sections and further analyzed in these sections. The importance of this factor is of course self-evident and thus not requiring further explanation.
2. THE MARKET STRUCTURE is very critical for profitability. The nature of the market, the location of the Marketplace, the customer base and the supplier structure is fully provided in several other sections of this study and therefore no further discussion is necessary.
3. MARKET SERVICED is the term used to denote the function between the product/s and services offered by companies and the particular market sector the marketing effort reaches.
In addition, there is the MARKET AVAILABILITY to consider as this represents the ‘real market’ available to any particular company or supplier.
THE TOTAL AVAILABLE MARKET
MARKET AVAILABILITY | ||||||||||||||||||||||||
Demand with no suitable product offering | ||||||||||||||||||||||||
Available Market | ||||||||||||||||||||||||
Demand controlled by fixed long term agreements with suppliers | ||||||||||||||||||||||||
Demand controlled by Public Policy, Government controls or preferences | ||||||||||||||||||||||||
MARKET SERVICED | ||||||||||||||||||||||||
Market Area Serviced by any particular Company | ||||||||||||||||||||||||
Thus the Market Area Serviced is the sector of the market for which companies are offering a suitable product or service and Available
Markets the sector of the market reached by the company's marketing effort. The areas marked as the overlap in the Market Area Serviced, i.e. the market sector for which companies are offering suitable product/s or services and which may theoretically be reached by the company’s marketing activities, but of which part is controlled by either other Purchasers or Suppliers. The Market Availability is the total market perceived by the total Purchaser universe; however the Available
Markets the market which is actually available to individual Suppliers.
The Market Area Serviced is the true market for companies in terms of product/s and services, however parts of this market may be difficult or impossible to attain due to the control exerted by either the controlling Purchasers or Suppliers.
HISTORIC DATA AND TIME SERIES
1997 - Current
The recent HISTORIC DATA in this section covers the years from 1997 to Current. This standard HISTORIC format (which essentially contains recent data) is the most popular time series demanded by readers. Many readers feel that it is more important to know what is likely to happen in the recent past rather that what has transpired in the long-term past.
FORECAST DATA AND TIME SERIES
Current to 2028
The FORECAST DATA in this section covers the years to 2028. This standard FORECAST format (which essentially contains future projections) is the most popular format demanded by readers. Many readers feel that it is more important to know what is likely to happen in the recent future rather that what may transpire in the far distant future. We can of course provide readers with other printouts of long-range forecast data and this is done as part of our Service.
CORPORATE DATABASE: These figures only refer to the Markets accessible to Industry Companies and may not reflect the overall or total markets for the products or market sectors.
1. ALL FIGURES IN THIS SECTION ARE IN REAL TERMS:
Current BASE
REAL TERMS are prices excluding the effects of inflation, thus the Market Consumption figure given can be readily converted into units or volume. This is done by applying the average sales prices for the current year and dividing the Market Consumption figures by this price for all years. Thus it is possible to easily ascertain previous and forecasted product volume.
A Current base is used because most company accounts are historic and thus readers will be able to compare the figures given in this volume with their own figures without the need for conversion or the need for inflators or multiplying factors.
The effect of using Real Terms figures is that the forecasted figures will be depressed, as they do not include inflation, and figures from former years (i.e. before the current year) will be increased.
2. The Market Consumption figures and the Trend figures represent an overall median probability trend line which is plotted to give the most probable course amongst the annual market forecast scatter. Thus the figures do not reflect year-on-year depressions and peaks in absolute terms, but instead represents a year-on-year modified trend line.
3. All analyses are based on correlations of the results of the Surveys of Suppliers, Distribution and Customers. Thus, for example, an analysis of Market Sectors will gain data firstly from the End User Surveys and secondly confirmations and correlations will be gained from the Surveys of Suppliers / Distributors. This in the opinion of the publishers is a very accurate method and is far superior than, for example, that which is used in the compilation of the majority of published governmental statistics.
4. All figures given in this volume refer only to the product/s covered and not to any other product or systems which may be connected or associated with the products covered.
5. The TREND figures given in the Industry section of this volume refers to the average year-on-year change in the period Current to 2028
6. The YEAR-ON-YEAR TREND figures given in this volume refer to the average year-on-year change in the period Current to 2028
The Current to 2028 AVERAGE GROWTH TRENDS figures refer to the long term trends over the period.
Thus the actual Trend is given by a year-on-year figure and the long-term Trends (marked in this volume as being Current to 2028) is given as a Real Terms Forecast.
LONG-RANGE FORECAST DATA AND TIME SERIES
The data in this LONG-RANGE FORECAST time series covers a period of 28 years. This is the standard long range forecast format and is usually used for planning production plant / capital projects, macro-economic trends and demographics data. We provide readers with this time series as part of our Service.
LONG-RANGE REGRESSIONAL HISTORIC ( 1972 - 1997 ) DATA AND TIME SERIES
The data in this LONG-RANGE historic time series covers the years to 1972-1997. This is the standard long range HISTORIC format. We provide readers with this time series (on request) as part of our Service to enable long range regressional analysis for forecasting models which require an extended time period analysis.
EXCHANGE RATES + PURCHASING POWER PARITY
The report database and forecasting models do not use current market or bank exchange rates as these can be deceptive. The rates used are those of the base year (Current) in addition to a number of real value factors which reflect the actual or forecasted value of the product in each of the national markets over the period 1974 to
the present. A simple conversion of local currency into U.S. Dollars or any other national currency cannot be used to adequately represent products or services.
The report database and forecasting models are attempting to show the relative values of products or markets free from any extraneous effects of currency movements or government fiscal policy which arbitrarily alter currency exchange rates. Thus the currency calculations and data in the database are indicating relative unit values or the relative cost of the product or service in the national market.
We do not indicate the Currency Conversion Rate that you can use with any calculations and readers will have to apply their own discretion in this respect. Beware however, such calculations involving currency conversions can be artificial and spurious and do not reflect real values of either products or markets.
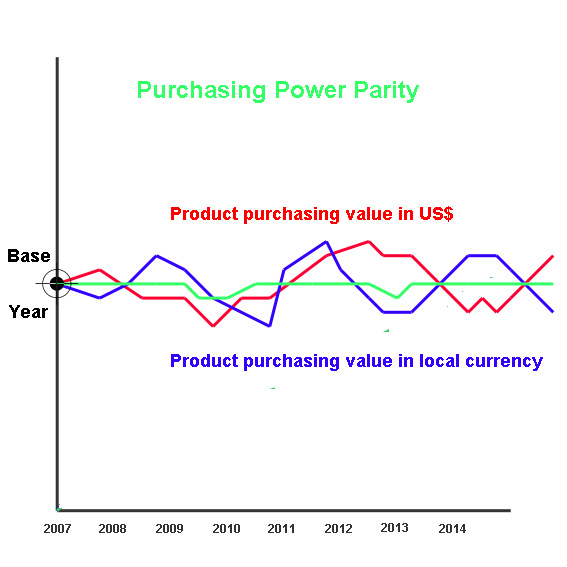
The diagram shows the problem of relating Product or Market Values or Costs in Real Terms (+), the National Currency Value in Real Terms (i.e. excluding the effects of Inflation) and the Value of another currency (the Converted Currency, given as $) in relation to the National Currency.
The U.S. government definitions are somewhat simplistic and thus the database and forecasting models used by us make use the following factors:-
1. | The UNIT VALUE of the Product |
2. | Discounting in the UNIT VALUE of the Product in the market |
3. | Stockholdings and the UNIT VALUE of those stocks |
4. | Forecast of UNIT VALUE of the Product |
5. | The Real Terms VALUE of the National Currency |
6. | The Factor between the CURRENT Value of the National Currency and the UNIT of Product over time |
7. | The Factor between the REAL TERMS Value of the National Currency and the UNIT of Product over time |
8. | Forecast of the National Currency in REAL TERMS |
9. | Forecast of the Factor between the REAL TERMS National Currency and the UNIT of Product over time |
10. | Each of the above factors (1-9) in relation to the Converted Currency both in CURRENT Value and REAL TERMS Value over time. |
THE PROBLEM OF CURRENCY EXCHANGE CONVERSIONS
The following diagram is used to explain the problems associated with Currency Conversions.
|
PURCHASING POWER PARITY
Where, O = Base Year, " —" = Product or Market Value or Cost in Real Terms, "—" = National Currency Value in Real Terms, Eg. Yen "—" = Converted Currency, E.g. US$. |
|
U.S. Government definitions |
The U.S. government uses currency parity estimates (for GDP and other economic measures) as have from time to time been revised from figures published in previous government statistics, including issues of the Handbook of International Economic Statistics, the Federal Reserve Bank, the Department of Commerce, and the CIA. Those bodies use purchasing power parity conversion rates based on Summers and Heston (PENN World Tables). The present estimates are based on purchasing power parity conversion rates published in the World Bank's World Development Report (1996, et seq.), a widely used source that includes a more up-to-date list of countries than the PENN World Tables. Estimates for countries not included in the World Development Report make use of the PENN World Tables and other published sources. Constant Versus Current Dollars Estimates of gross domestic product (GDP) are presented in base year (1996, 2001, etc.) US dollars. In contrast, foreign trade figures are presented in current dollars, that is, in dollars of the year to which the figure pertains. GDP Methodology Estimates of national data (E.g. gross domestic product - GDP) estimates are based on purchasing power parity (PPP) calculations rather than on conversions at currency exchange rates. PPP dollar estimates are calculated by applying standardized international dollar prices to a country's output of goods and services and are the best measure for international comparisons of GDP. The GDP data presented in this publication represent the latest available estimates for individual countries, regional groupings, and world totals. GDP figures are frequently revised and vary according to the source and/or date of estimate. Consequently, some of the GDP data reported in may differ somewhat from data presented in other Agency publications - including the CIA - because of different cut-off dates in researching and compiling the data. |
PRODUCT PARITY
The basis of the data provided is to allow users to produce business plans and forecasting models across national and statistically diverse boundaries. Thus it is necessary to adopt a standard product definition which can be then applied across national borders. The product definition chosen is the U.S. government’s NAICS product codes (and the previous SIC product codes where relevant). The problem is to apply these product definitions across the national boundaries. The U.S. government stubbornly clings to the imperial system of measurement and this further complicates the matter.
The use of PRODUCT PARITY is intended to allow trans-national business planning and forecasting (however readers can request data based on national product definitions), and in general terms Product Parity means that equivalent products are compared even where the exact technical specification, or quantification, of the product is not the same. Thus a 12 fluid ounce liquid container as defined in the (Imperial measuring system) NAICS product codes is quantitatively equivalent to 35.5ml, however for the purposes of Product Parity it will be the equivalent of a 33ml liquid container in countries with a Metric measuring system. Similarly in non-Metric markets a 16 ounces or 1 pound Imperial measure, whilst actually equivalent to 454 grams, will equate to a 450 gms product in Metric measure markets.
For many products this ‘Product Parity’ will be based on the ‘Purchasing Parity unit costs’ -v- ‘product performance’, rather than ‘unit cost’ -v- ‘technical specifications’. This is because national markets impose different technical specifications on products which essentially fulfill the same customer requirement, and thus these products have a Product Parity which can be used for uniform, cross border, business planning and forecasting.
REPORT TYPES
The Market Data given in this report falls into one of a number of Report Data Types, these are as follows:-
MULTI-CLIENT REPORTS
Multi-Client Reports give a breakdown of the Markets and Products covered in terms of the normal terminology and definitions of the market-place, i.e. the definitions of the Clients who specified the Reports. In addition some reports will contain breakdowns by End User Sector or Application Sectors and will use the terms prevalent in those areas.
PRODUCT REPORTS
Product Reports give a breakdown of the Products and Markets covered in terms of the Standard 7-Digit U.S. Government Department of Commerce Product Code.
Product Sector Reports give highly detailed information on each separate single 7-Digit Product Code through one or more highly discrete breakdowns and analyses of the Products and Markets Sub-Sectors.
MARKET & INDUSTRY REPORT
NAICS Reports give a breakdown of the Industries, Products and Markets covered in terms of the 4 or 6-Digit N.A.I.C.S. Classifications.
S.I.C. Industry Reports give breakdowns of the Industries, Products and Markets covered in terms of the Standard 5-Digit U.S. Government Department of Commerce Product Code.
Major Industry Reports give a breakdown of the Industries, Products and Markets covered in terms of the 3 or 4-Digit S.I.C. Classifications.
PRODUCT & INDUSTRY REPORTS
Reports are produced by 2, 3, 4, 5, or 7-Digit SIC code or 2, 3, 4, 5, 6, 7, 8 or 10-Digit NAICS code.
MATERIALS REPORTS
Materials Reports give a breakdown of the Materials Consumption of Industries covered in terms of the Standard 6 or 7-Digit U.S. Government Department of Commerce Product Code. Materials Reports are designed to show the Value or Volume of Materials, Products and Services consumed by each of the 4-Digit S.I.C. or N.A.I.C.S. Industries.
For example Report number T3711: MOTOR VEHICLES + CAR BODIES
GEOGRAPHIC COVERAGE
 Geographic coverage of the databases